6.1 Metaphor and quantitative evidence
6.1.1 Coding
One of the main challenges concerning metaphor in corpus linguistics is that it is hard, and sometimes impossible, to extract metaphorical uses automatically. The following list highlights the major implications of this.
- Manual coding is time-consuming
- Manual coding is error prone; requires rigorous operationalization
- Frequencies of metaphorical uses are often dwarfed by non-metaphorical uses
- There is often no way to distinguish “literal” and “metaphorical”
6.1.2 Frequency and scales
- Absolute frequency
- Basic measure
- Should always be reported since everything else is based on it
- Sometimes hard to visualize
- Hard to interpret across different sample or category sizes
- Relative frequency
- Absolute frequency divided by all occurrences
- Either between 0 and 1 or 0% and 100%
- Makes it possible to compare between different sized samples or sub-categories
- extremely low relative frequency is sometimes reported as normalized frequency, e.g. 1 per Million vs. 0.000001 vs. 0.0001%
6.1.3 Frequency and scales
- Log scale
- Most commonly base 10, i.e. 1 to 10 is the same distance as 10 to 100, 100 to 1,000, etc.
- Uses:
- Visualize heavily skewed data
- Make exponential data linear (e.g. word counts)
- Approximate human perception of quantities
- Pie charts
- variant of stacked bar chart
- becomes hard to interpret with many categories
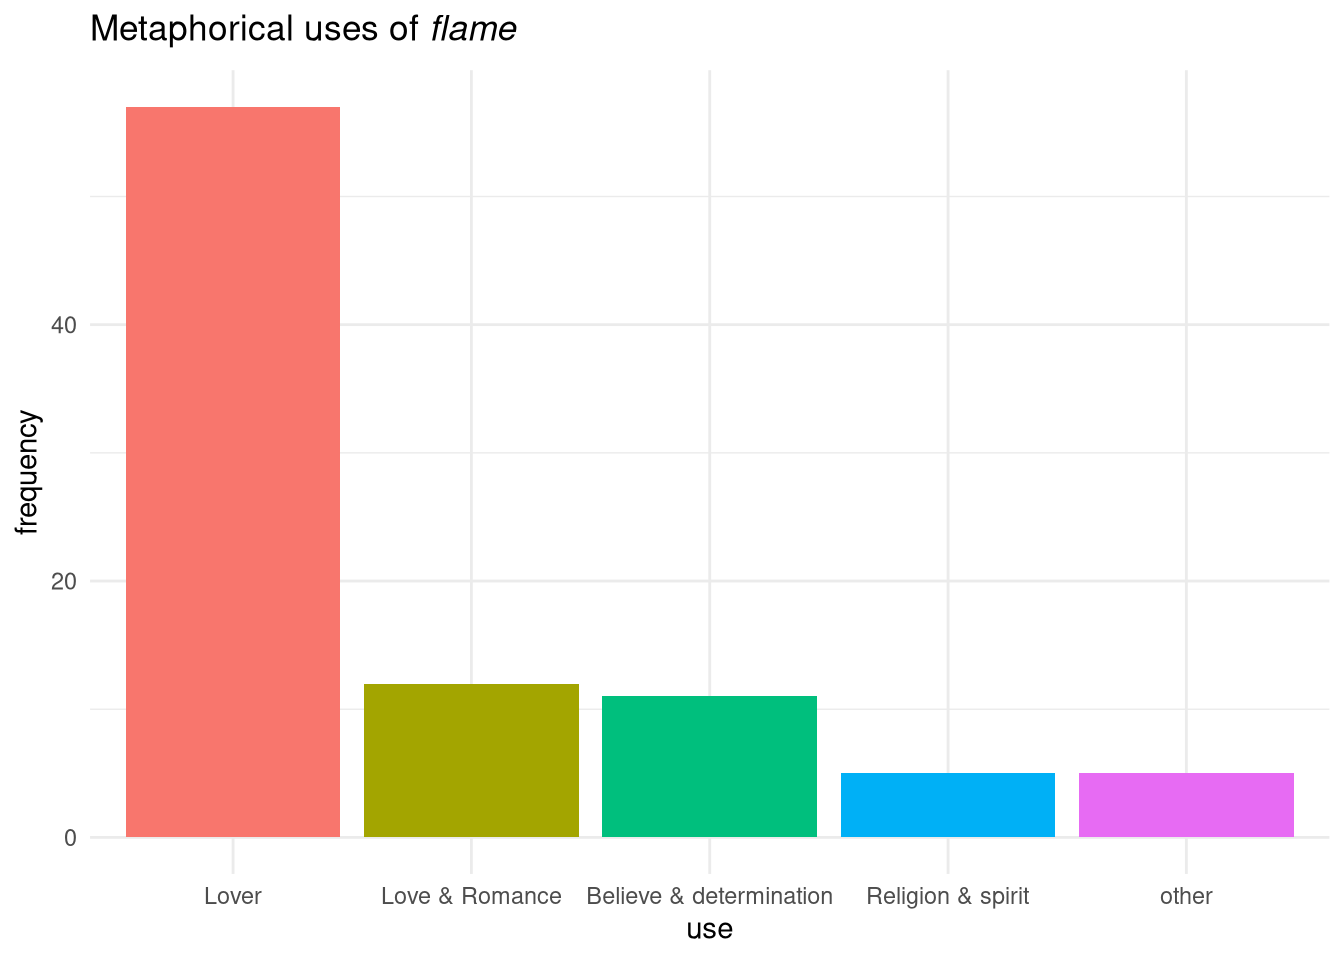
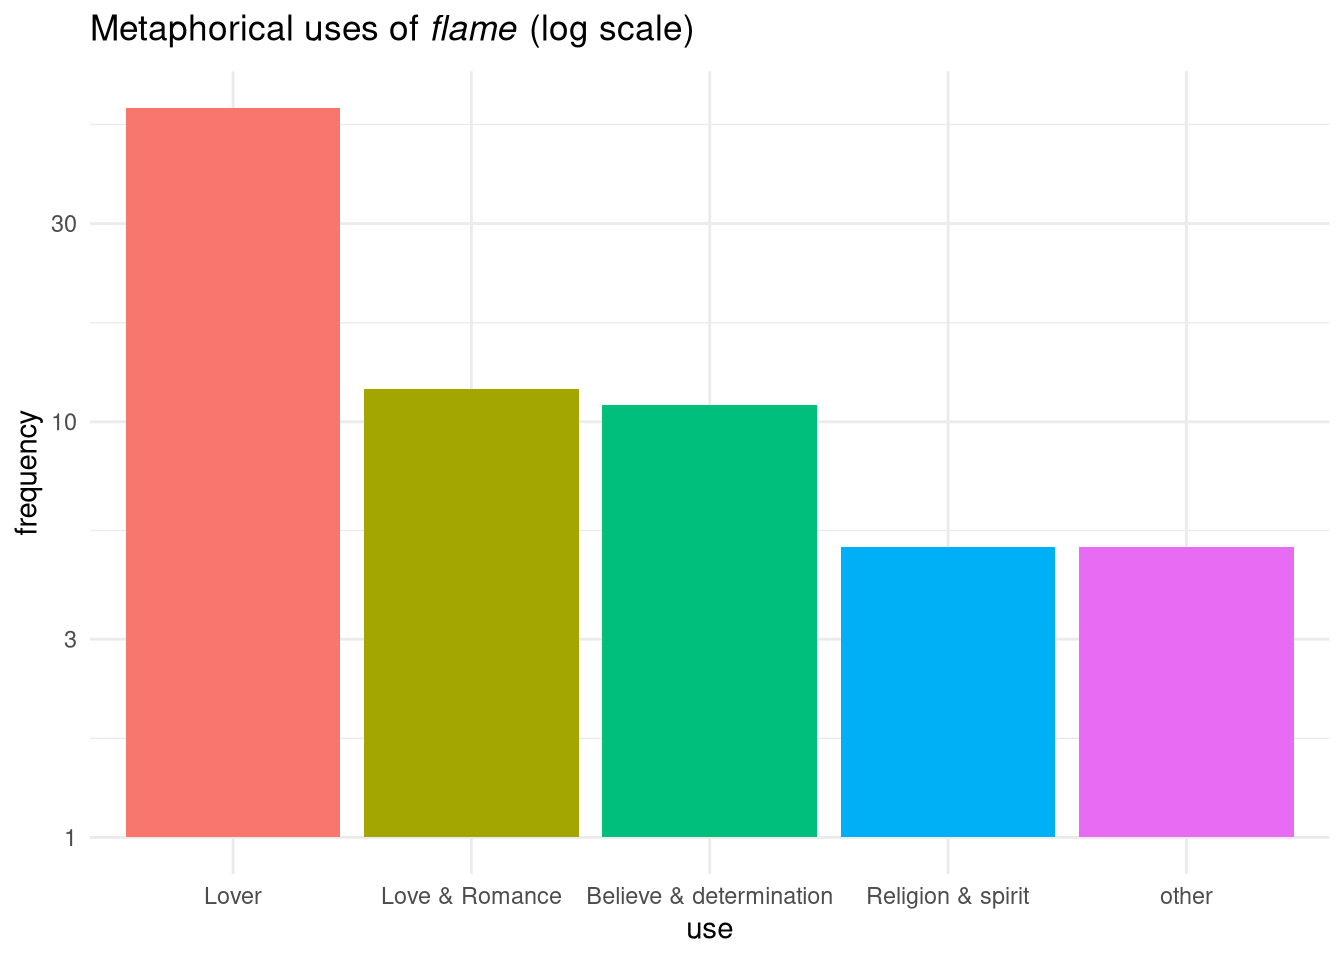
6.1.4 How extreme are the differences?
If we take into account the proportional nature of our perception, we might get a better picture of frequency differences on a log scale, which essentially emphasizes proportional differences rather than absolute ones. If you compare the two graphs below you might not change your conclusion about the data, but the felt difference between the categories might be much smaller than you would think. As stated above, these considerations are to be taken with a grain of salt on such small data sets.